
Welcome to the Capacitor Fundamentals Series, where we teach you about the ins and outs of chips capacitors – their properties, product classifications, test standards, and use cases – in order to help you make informed decisions about the right capacitors for your specific applications. After describing dielectric classifications in our previous article, let’s discuss capacitor test conditions and electrical properties.
Electrical behavior of ceramic chip capacitors is strongly dependent on test conditions, most notably temperature, voltage and frequency. This dependence on test parameters is more evident with Class II ferroelectric dielectrics, and negligible or more easily predictable with Class I formulations. Therefore, certain industry standards of measurement have been established that give appropriate limits of performance for any given electrical property and dielectric characteristic.
Temperature Dependence
Temperature Coefficient (Capacitance and Temperature Dependence)
In general, materials with higher dielectric constants K at 25°C display greater change when the temperature shifts. The temperature coefficient of capacitance (TCCor T.C.) measures the variance of capacitance with temperature and is expressed in units of ppm/°C (parts per million per degree centigrade) for Class I capacitors and %ΔC (percent change in capacitance) from room temperature measurement for Class II capacitors.
Dielectric Loss and Temperature
Class I dielectrics display only negligible change in dissipation factor (DF) with temperature over the standard -55°C to 125°C temperature range, whereas Class II dielectrics show a general decrease of DF with temperature (notably at or near the Curie Point of the material). At 25°C room temperature, industry standards require for the DF for standard Class I dielectrics (such as C0G-NP0) to not exceed 0.1%, whereas the DF for Class II Mid-K dielectrics (such as X7R) should not exceed 2.5% and the DF of Class II High-K dielectrics (such as Z5U and Y5V) should not exceed 3.0%.
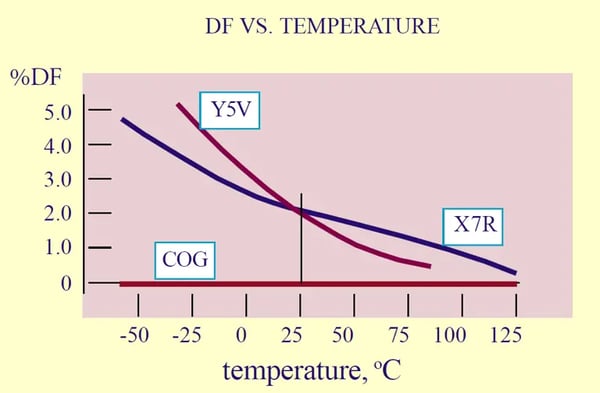
Figure 1. Dielectric dissipation factor curves with temperature
Insulation Resistance and Temperature
The capacitance of a capacitor is inversely proportional to its insulation resistance (IR), which is a measure of the capability of a material to withstand leakage of current. Since thermal energy increases the diffusion of charge carriers, leakage of current increases with temperature. Typically, the IR of most dielectrics at 125°C decreases by a factor of one to two orders of magnitude from the 25°C measurement. Industry standards require that the IR readings at 125°C exceed 100 ohm-Farad (ΩF).
Dielectric Strength and Temperature
The dielectric strength of insulators is inversely proportional to temperature, since heat lowers the intrinsic resistivity of the material. As a general rule, a properly designed capacitor of sound construction should withstand the normal 25°C dielectric withstanding flash voltage even when the temperature is 125°C.
DC Voltage Dependence
VDC Coefficient (Capacitance and DC Voltage Dependence)
When a DC voltage is applied, all Class II ferroelectric formulations experience an eventual decrease in dielectric constant, and this impact is more severe with dielectrics of higher dielectric constant. The behavior is attributed to a constraint of the DC voltage on the response of the polarizing mechanisms which give rise to the dielectric constant of the material.
As seen in Figure 2, the expected capacitance changes with increased volts/0.001” (0.0254 mm) DC bias. The thickness of the individual dielectric layers determines the volts/mil loading of the device during operation. Therefore, capacitors of identical capacitance value and voltage rating may behave quite differently depending on the internal construction of the capacitors.
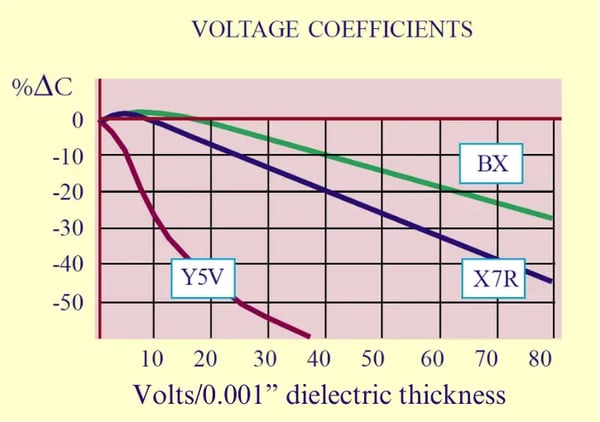
Figure 2. Voltage coefficients for DC bias
This effect is of considerable importance in the design of capacitors intended to meet characteristics which require that the combined temperature and voltage coefficients (TVC) not exceed a certain ΔC over the operating temperature range, at working voltage. Assuming that a dielectric is available with T.C. characteristics well within the ±15% maximum ΔC, the manufacturer usually needs only be concerned with the negative contribution of the voltage coefficient.
For example, let’s consider a X7R capacitor of 0.1 µF that is rated for 200 VDC. This multilayer ceramic capacitor (MLCC) is constructed with 35 layers that are 0.00018 inches or 0.0457mm thick, which means the dielectric layers only experience 111,111volts/inches or 4.4 micron when operating at 200 VDC. Therefore, according to Figure 2, the voltage coefficient (VC) is only -15%. If the T.C. of the dielectric is ±7%ΔC and the VC is -15%ΔC, then the maximum TVC is +7%-22% ΔC.
Voltage Conditioning and Aging
Class II dielectrics experience an accelerated aging effect when stressed by DC voltage, even at room temperature, and the effect is even stronger at higher voltages and with dielectrics with elevated dielectric constants. When manufacturing close tolerance (±5%) Mid-K dielectrics, or high voltage units, the product is usually reheated after IR or dielectric withstanding voltage testing in order to maintain capacitance tolerance and establish a fresh aging cycle. X7R units may derate as much as 3% in capacitance after DC withstanding voltage testing at 300,000 volts/inches or 11.8 volts/micron.
Dissipation Factor and DC Voltage
Class II dielectrics experience a decrease in dielectric loss with increasing voltage. In fact, the DF may be reduced by a factor of 75% at 100,000 volts/inches or 3.9 volts/micron bias for X7R dielectrics.
AC Voltage Dependence
AC Voltage Coefficient (Capacitance and AC Voltage Dependence)
With Class II capacitors, the dielectric constant always increases with the AC test voltage (with higher K dielectrics responding more readily), until some threshold voltage value is reached where the effect reverses. Class I dielectrics, operating in the paraelectric state, display negligible or only limited response to the AC bias.
Industry standards specify a test voltage of 1.0 ±0.2 Vrmsfor all dielectrics, with the exception of some High-K less stable Class II bodies which are typically specified by manufacturers at 0.1 or 0.5 Vrms. Application of these materials at other voltages therefore presents correlation problems, even at low voltage stress (under 5 Vrms/0.001") as seen in Figure 3. As with the DC voltage coefficient, the situation is further complicated by the added variable of capacitor design (i.e., dielectric thickness of the individual layers).
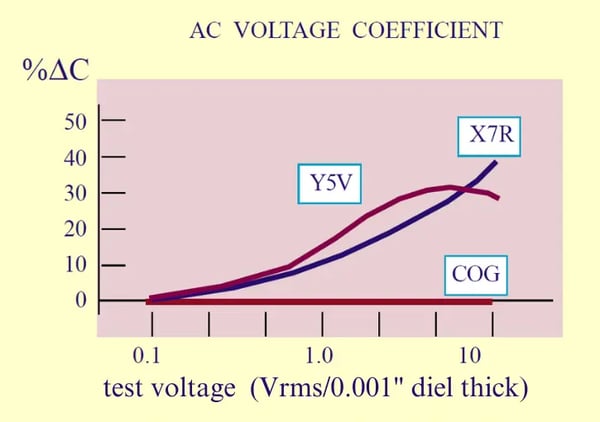
Figure 3. AC voltage coefficients
Dissipation Factor and AC Voltage
The increase of dielectric constant with AC test voltage is accompanied by a marked increase in the dissipation factor, as illustrated in Figure 4. Since MLCCs are constructed with thin dielectric layers, they are not ideal for use circuitry with large AC voltage and high current, as dielectric losses become quite significant between 5 and 20 Vrms/0.001" stress.
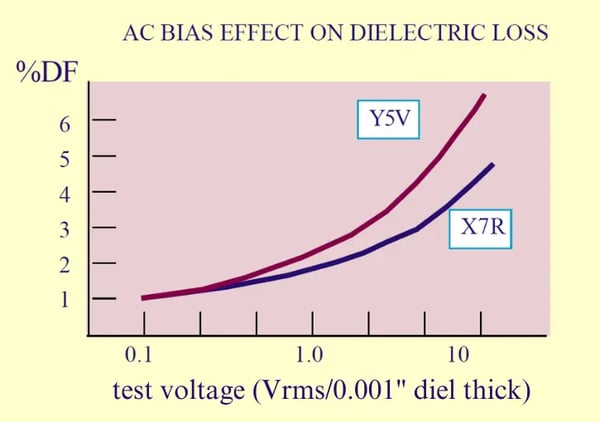
Figure 4. AC bias effect on dielectric loss
Frequency Dependence
Previously, we discussed the close interrelationship of frequency and dielectric polarization and dielectric loss. Essentially, increased frequency of an applied field results in a decrease of the measured capacitance value. Some polarizing processes have slower reaction times that cannot keep up with high frequency polarity reversals of the field, resulting in decreased dielectric constant and increased dielectric loss.
These effects are common to all the dielectric groups but are more predominant in the ferroelectric formulations which display large ionic polarization. Typical curves for capacitance and dissipation factor versus frequency are illustrated in Figures 5 and 6.
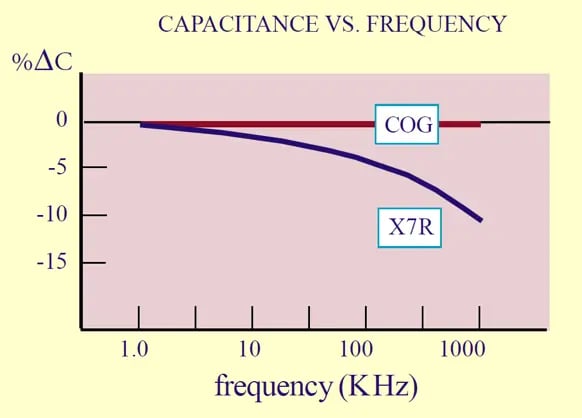
Figure 5. Capacitance vs. frequency
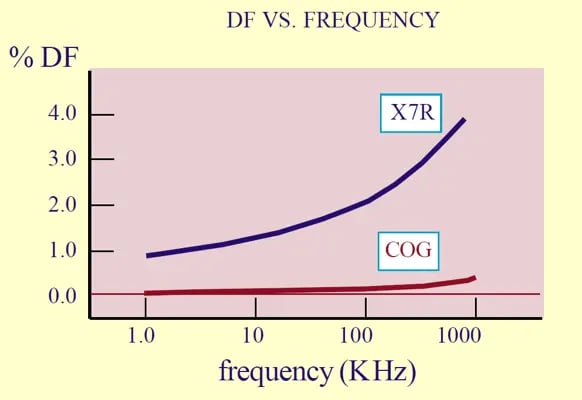
Figure 6. Dissipation factor vs. frequency
Aging and Time Dependence
As discussed in part 5 of our series, ferroelectric dielectrics exhibit aging, where capacitance loss occurs as the ions in the crystal lattice shift and stabilize to positions of lower potential energy. Restraints on the percentage capacitance loss per decade hour aging rates are usually specified by users of chip capacitors.
X7R is expected to age less than 2.5%/decade hour, and most dielectrics within this characteristic typically have aging rates from 0.8% to 2.0% per decade hour. The High-K aging specification is more liberal by necessity; an aging rate of 5% per decade hour is considered normal. Many of the Class II dielectrics may also display aging of the dissipation factor, an effect more predominant with High-K formulations.
Hopefully, Part 9 gave you a better understanding of dielectric test parameters and how their results may affect your specific application. In Part 10, we’ll be diving into industry test standards. Also, check out our Knowles Precision Devices Capacitors to view our complete product offering.
To learn more about capacitors, download our ebook, A Guide to Selecting the Right Capacitor for Your Specific Application.